Outlier Removal
Overview
Outlier removal can become essential when quantizing activations, particularly in scenarios where certain layers produce output activation tensors with skewed value distributions.
Such outliers can mess up the selection of quantization parameters.
Trouble Situation
The quantization accuracy may degrade when there are outliers (activation values far from the average activation of representative dataset) in the quantized layers of your model.
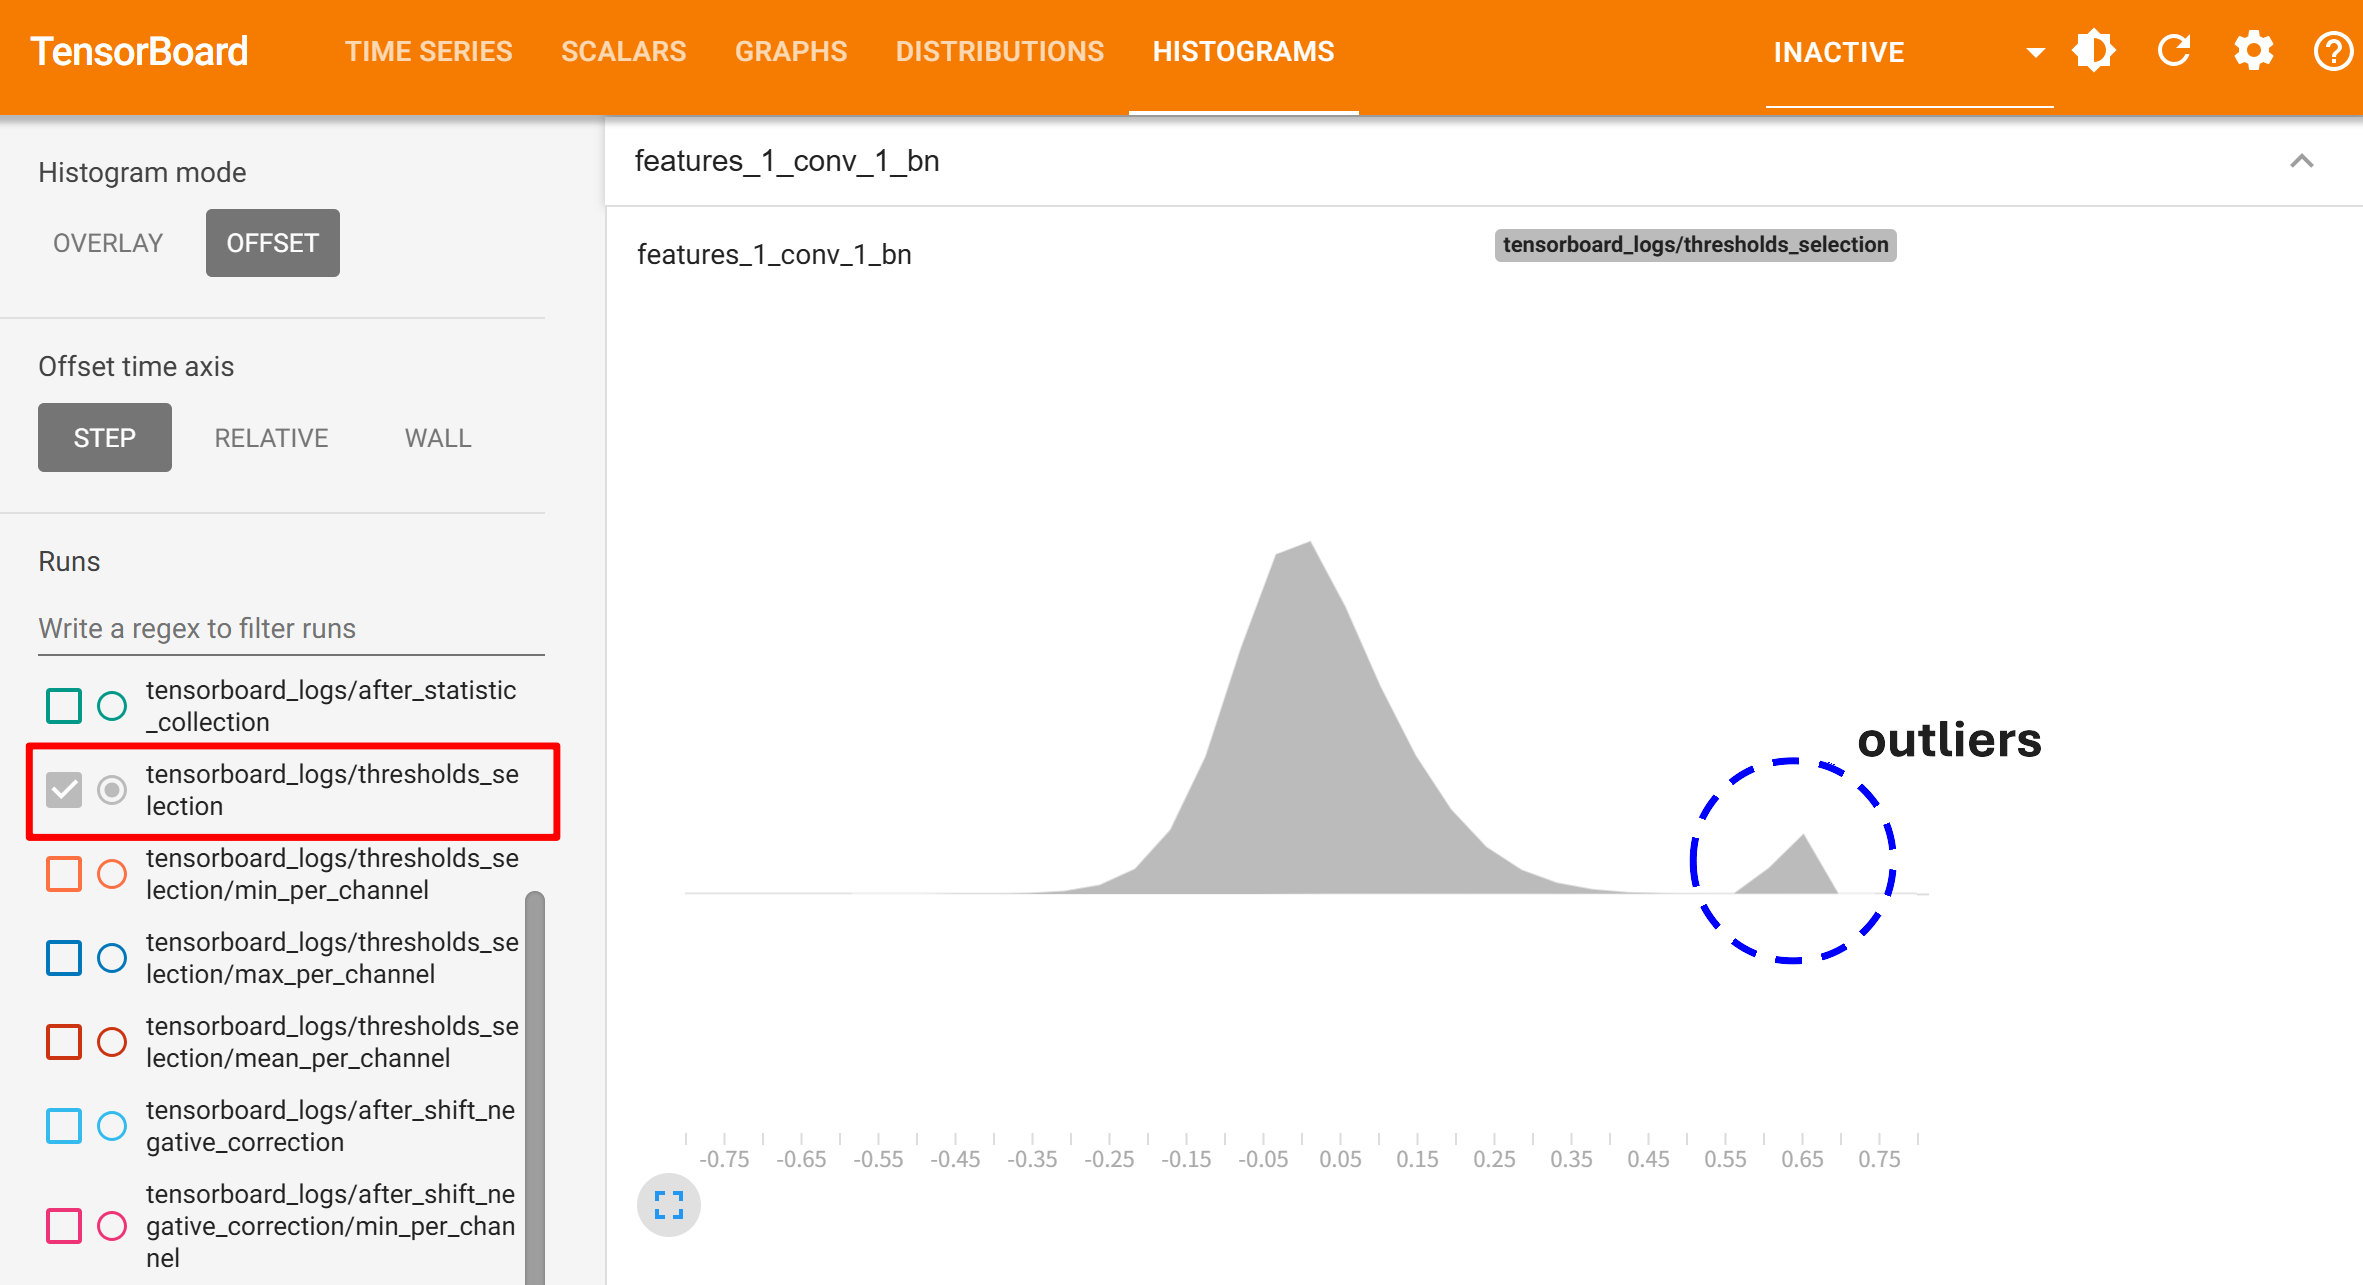
For example, you can check if activation tensors have outliers by visualizing the histograms in TensorBoard(thresholds_selection in the below image).
Solution
Manually limit the activation thresholds using the z_threshold attribute of QuantizationConfig in CoreConfig.
Set z_threshold to a value. Typical value range is between 5.0 and 20.0.
core_config = mct.core.CoreConfig(mct.core.QuantizationConfig(z_threshold=8.0))
quantized_model, _ = mct.ptq.pytorch_post_training_quantization(..., core_config=core_config)
Appendix: How to Read the Outlier Histograms
After execution XQuant Extension Tool, it makes the histograms for the degraded layers containing the detected outliers. The histograms are saved in a directory named “outlier_histgrams” created in the path specified in XQuantConfig.report_dir.
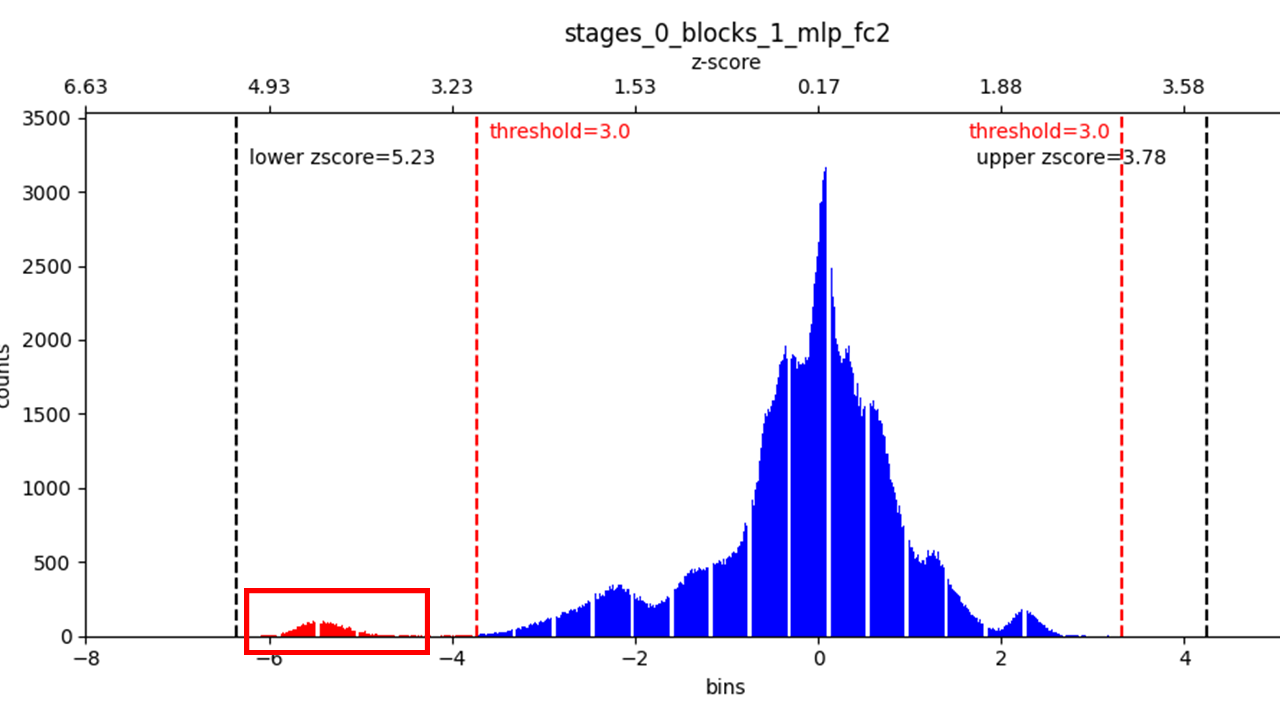
First X-axis(lower part): Indicates bins that finely divide the range of data values.
Second X-axis(upper part): Shows the z-score values corresponding to the primary X-axis.
Red dashed line: The z-score threshold set in XQuantConfig.
Black dashed line
Lower zscore: Indicates the maximum value on the lower side of the histogram.
Upper zscore: Indicates the maximum value on the upper side of the histogram.
An example of a histogram detected by Outlier Removal is shown. In this example, outliers appear in the range from about 3.9 to 5.3 on the lower end of the z-score. Therefore, setting the z-score threshold to 3.9 will allow these outliers to be removed.